SeriesPoint
Define the style properties for a point series in a chart.
This archetype only provides styling information and should be logged as static
when possible. The underlying data needs to be logged to the same entity-path using
archetypes.Scalar.
Components components
Optional: Color, MarkerShape, Name, MarkerSize
Shown in shown-in
API reference links api-reference-links
Example example
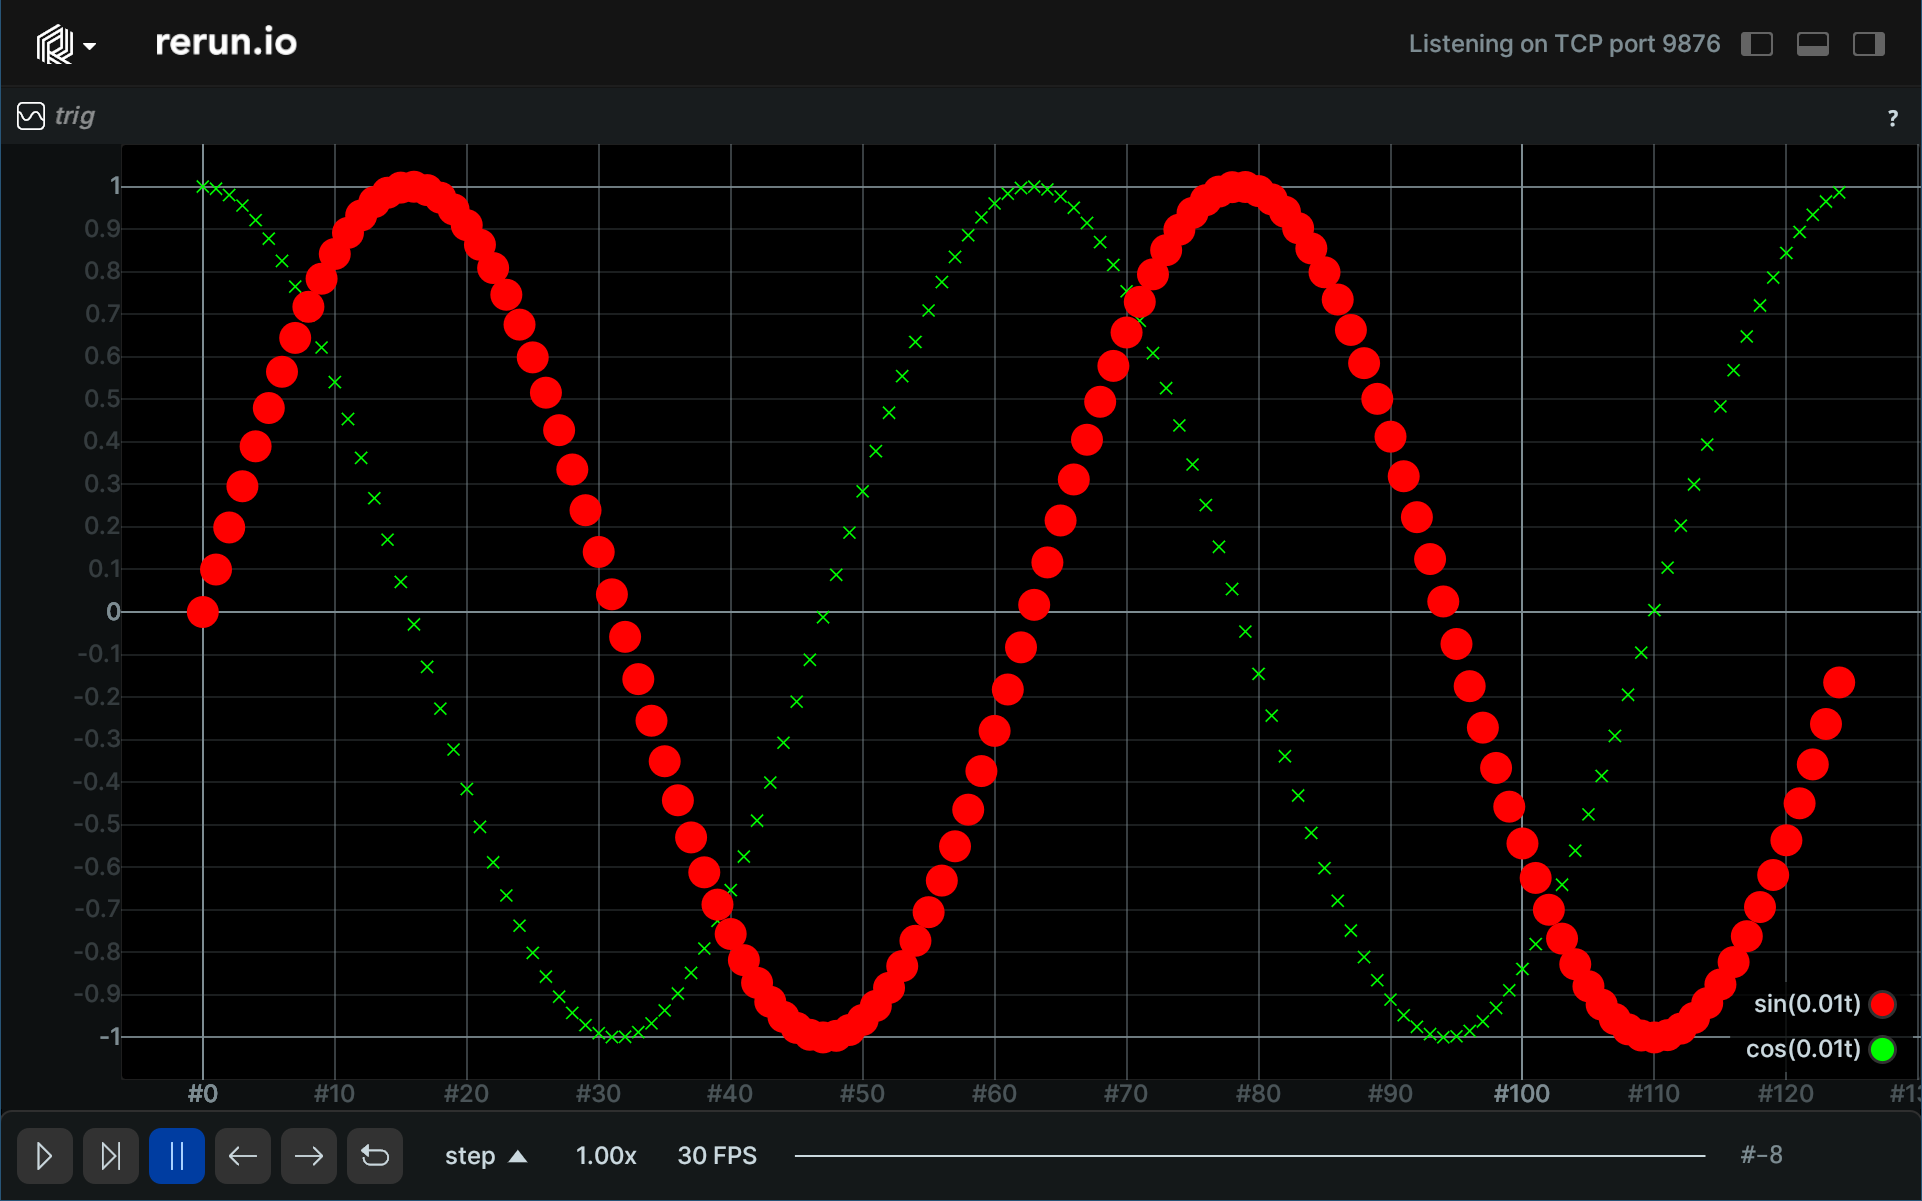
Point series point-series
"""Log a scalar over time."""

from math import cos, sin, tau

import rerun as rr

rr.init("rerun_example_series_point_style", spawn=True)

# Set up plot styling:
# They are logged as static as they don't change over time and apply to all timelines.
# Log two point series under a shared root so that they show in the same plot by default.
rr.log(
    "trig/sin",
    rr.SeriesPoint(
        color=[255, 0, 0],
        name="sin(0.01t)",
        marker="circle",
        marker_size=4,
    ),
    static=True,
)
rr.log(
    "trig/cos",
    rr.SeriesPoint(
        color=[0, 255, 0],
        name="cos(0.01t)",
        marker="cross",
        marker_size=2,
    ),
    static=True,
)

# Log the data on a timeline called "step".
for t in range(0, int(tau * 2 * 10.0)):
    rr.set_time_sequence("step", t)

    rr.log("trig/sin", rr.Scalar(sin(float(t) / 10.0)))
    rr.log("trig/cos", rr.Scalar(cos(float(t) / 10.0)))